手撕求解偏微分方程——差分法
1 | %reset -f |
解偏微分方程——差分法
$$\dfrac{\partial u}{\partial t}=\nu\dfrac{\partial^2u}{\partial x^2}+\nu\dfrac{\partial^2u}{\partial y^2}$$
$$\dfrac{u_{i,j}^{n+1}-u_{i,j}^n}{\Delta t}=\nu\dfrac{u_{i+1,j}^n-2u_{i,j}^n+u_{i-1,j}^n}{\Delta x^2}+\nu\dfrac{u_{i,j+1}^n-2u_{i,j}^n+u_{i,j-1}^n}{\Delta y^2}$$
$$u_{i,j}^{n+1}=u_{i,j}^n+\dfrac{\nu\Delta t}{\Delta x^2}\big(u_{i+1,j}^n-2u_{i,j}^n+u_{i-1,j}^n\big)+\dfrac{\nu\Delta t}{\Delta y^2}\big(u_{i,j+1}^n-2u_{i,j}^n+u_{i,j-1}^n\big)$$
1 | import numpy as np |
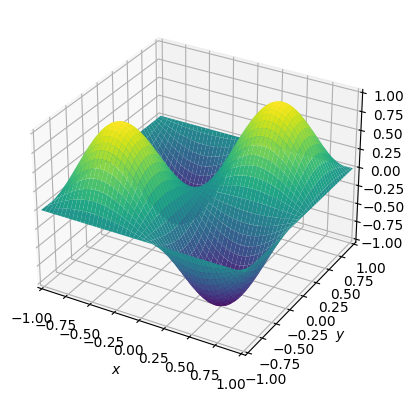
C:\Users\w1858\AppData\Local\Temp\ipykernel_11756\328840734.py:30: MatplotlibDeprecationWarning: Calling gca() with keyword arguments was deprecated in Matplotlib 3.4. Starting two minor releases later, gca() will take no keyword arguments. The gca() function should only be used to get the current axes, or if no axes exist, create new axes with default keyword arguments. To create a new axes with non-default arguments, use plt.axes() or plt.subplot().
  ax = fig.gca(projection='3d')


Text(0.5, 0.5, '$y$')
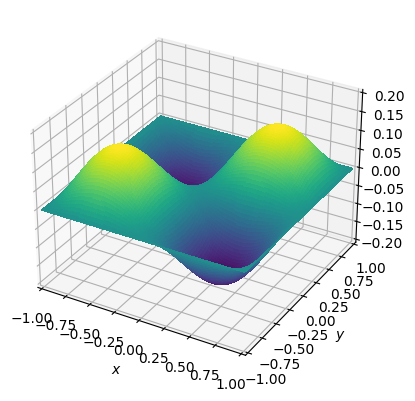
1 | nt= 1000 |
C:\Users\w1858\AppData\Local\Temp\ipykernel_11756\1993782575.py:15: MatplotlibDeprecationWarning: Calling gca() with keyword arguments was deprecated in Matplotlib 3.4. Starting two minor releases later, gca() will take no keyword arguments. The gca() function should only be used to get the current axes, or if no axes exist, create new axes with default keyword arguments. To create a new axes with non-default arguments, use plt.axes() or plt.subplot().
  ax = fig.gca(projection='3d')
本博客所有文章除特别声明外,均采用 CC BY-NC-SA 4.0 许可协议。转载请注明来自 Asphyxia's Blog!
评论
ValineDisqus